ASSIGNMENT 2
Manipulating data and SAS logic
This assignment begins by inputting a file containing data on graduate school applicants. These data are real, coming from applicants to all three of our graduate programs. There is no identifying information, so there is no way to figure out whose numbers are whose. Keep in mind as you do the analyses for this assignment, that the results come from real people. It will be interesting to see what these data tell us about applicants to at least one psychology graduate program. Click on the highlighted links for the formulas you will need for this assignment.
The data file you will need is gsapp2.dat, which you can download by clicking on it. The variables in order are: undergraduate GPA, GREQ, GREV (which are all three digits, with GPA having a x.xx format), and gender, which is coded F and M.
Part A
The university has minimum standards for admission to graduate programs, which is a 3.0 undergraduate GPA and a 1000 combined GRE score (Q + V). Write a program to screen all applicants to determine how many do and do not meet both of these standards. Write a report that states how many met and didn't meet each standard separately, as well as both standards combined.
Part B
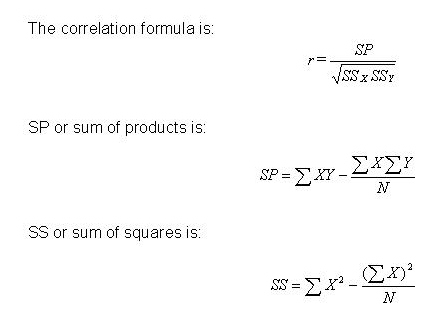
Is there a correlation between GPA and GRE verbal? Write a program to compute the correlation between them. Use PROC CORR to find out what value you should get, as a check. See Chapter 9 for instructions on running this and other procs. As always, be sure to use PUTS to label your results.
Part C
The next question is whether or not there are gender differences in GREV. To do this, use IF statements to divide your sample into two groups, and compute means for each.
Part D
Finally, compare the means from Part C with a t-test. Use PROC TTEST to make sure you computed this properly (see Chapter 9 of your book for instructions).
See the Tips section for some hints that may help with this assignment.
Copyright Paul E. Spector, All rights reserved, April 6, 1999.